
The wheel, fully instrumented.
Most tools treat every contract as a separate trade and every assignment as an ending. Cresori treats the wheel as what it is — one position, turning — and measures it that way.
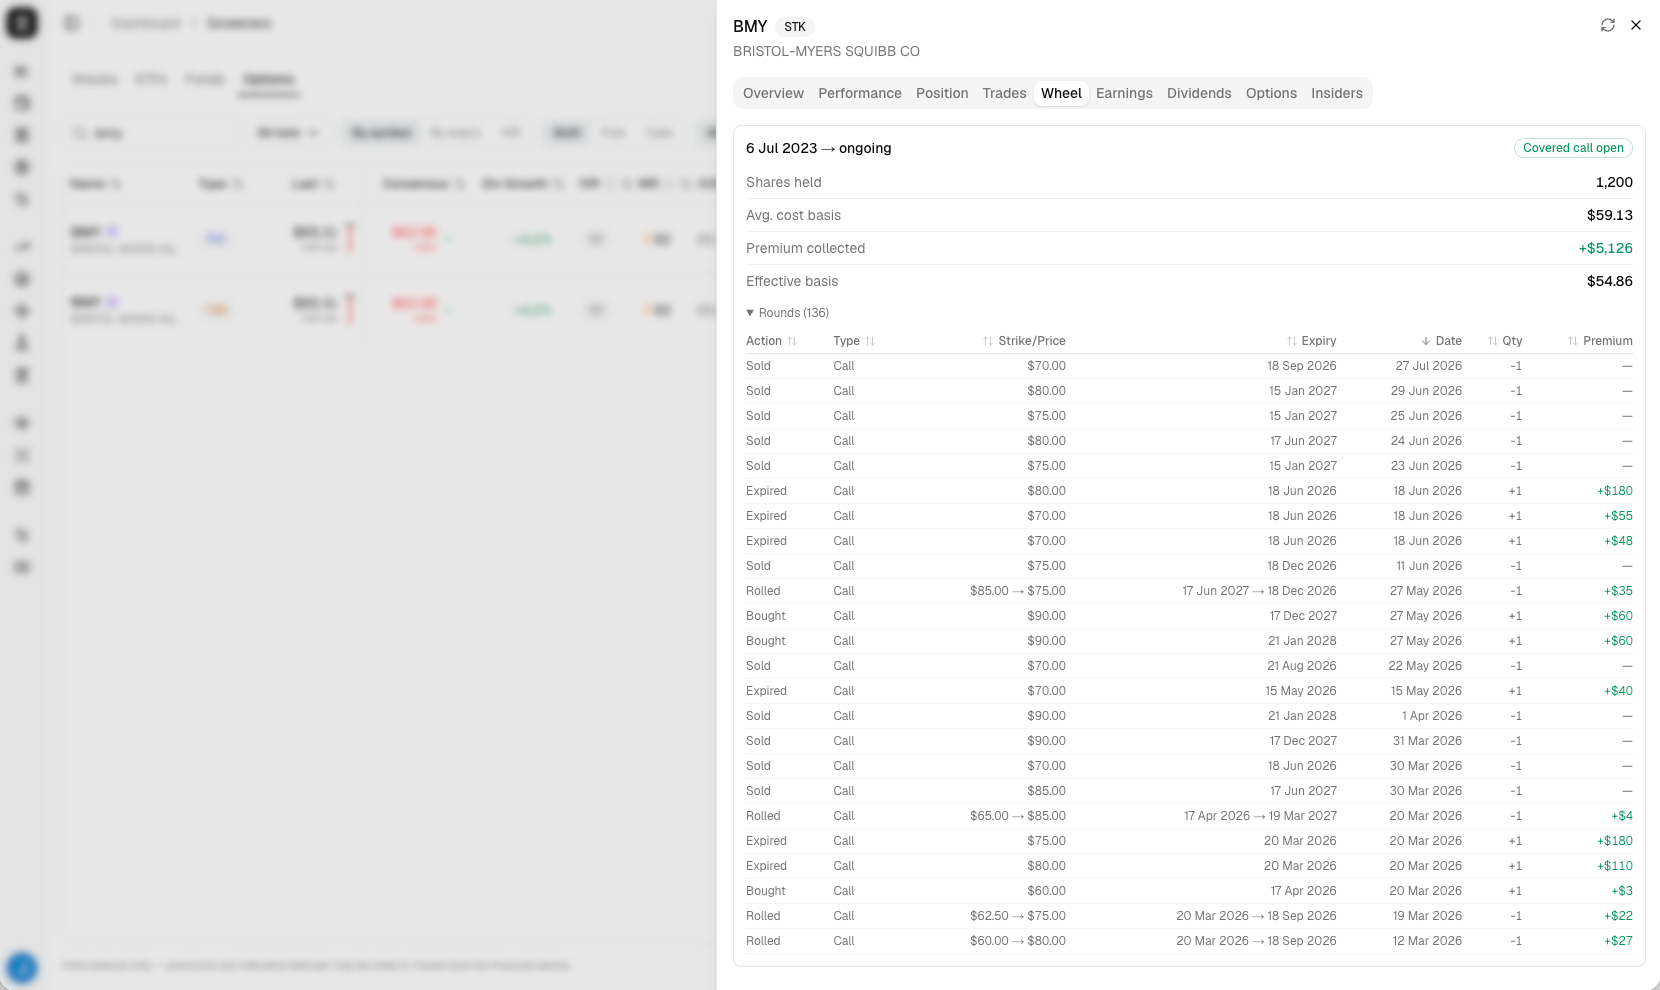
One wheel, not forty scattered trades
Sell a put, get assigned, write a call, get called away — Cresori stitches that back into a single economic cycle and tells you what the whole round actually made.
- ✓Put → assignment → covered call → called away, reassembled automatically
- ✓Works both directions, including the short-stock mirror
- ✓FIFO cost basis carried across the assignment boundary
- ✓Sortable Rounds view: how many cycles, and what each one returned
A heat map that prices time, not just distance
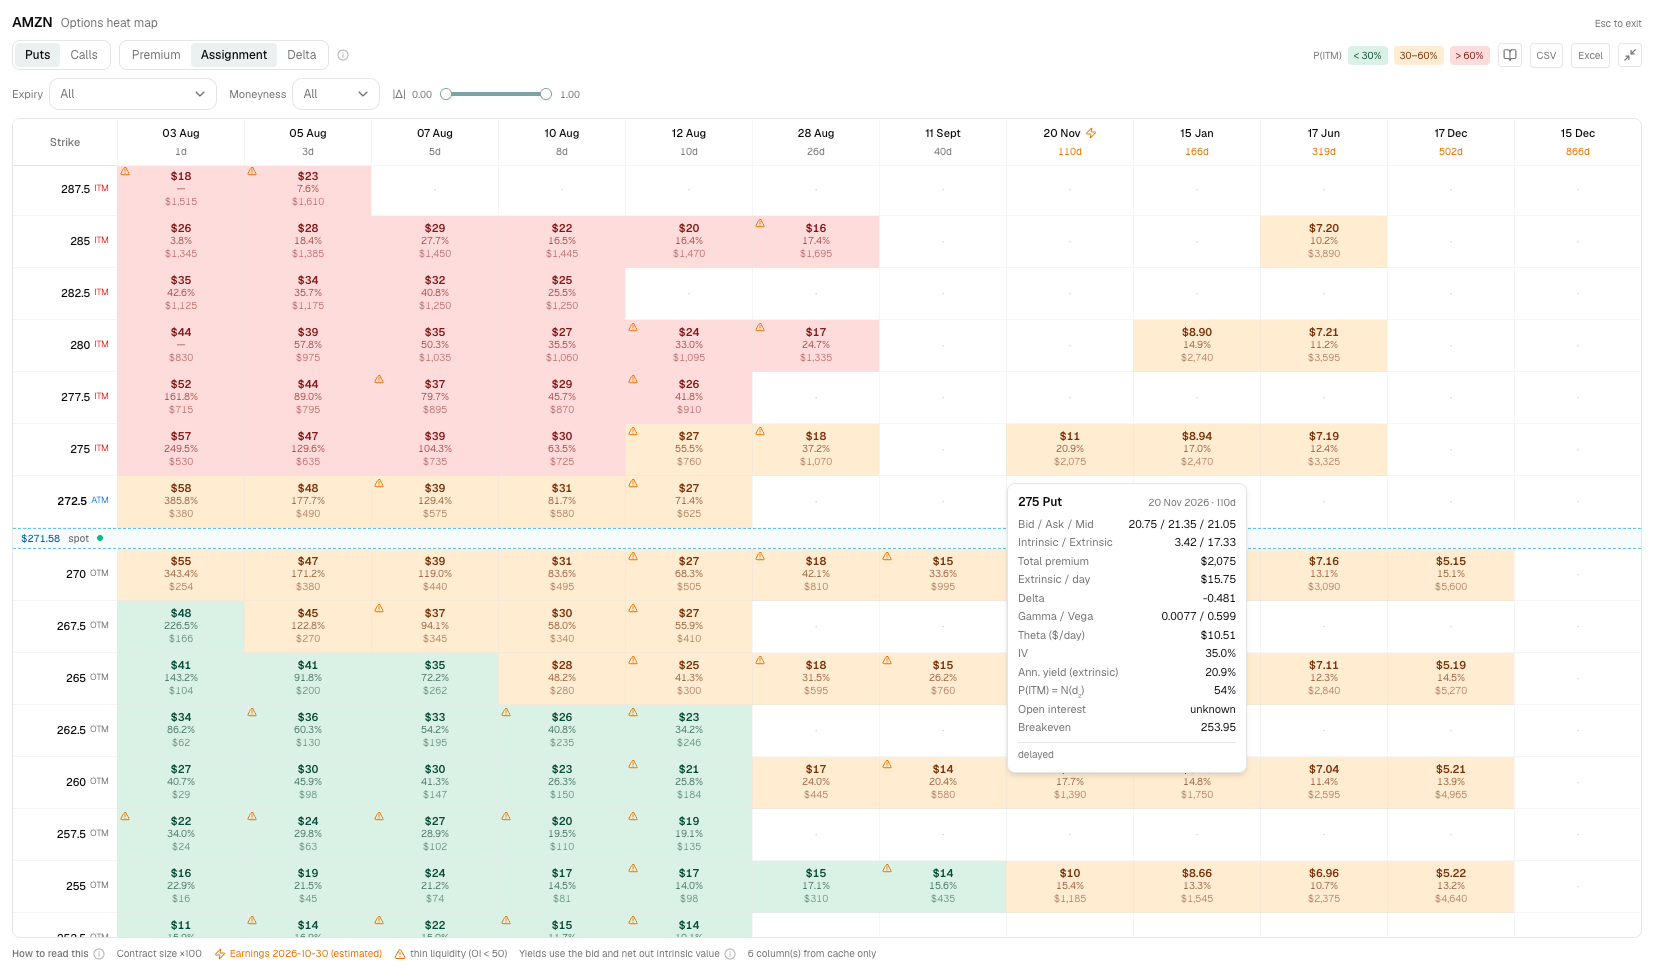
Every strike against every expiry, coloured by delta — and each cell tells you the dollars of theta per day and the yield annualised on extrinsic value, which is the only yield that means anything to a seller.
- ✓$/day theta and annualised extrinsic yield in every cell
- ✓Earnings dates overlaid so you never write blind through a print
- ✓Greeks on hover, auto-centred on the money
- ✓Renders from cache — no broker gateway needs to be running
Which tickers are actually worth wheeling
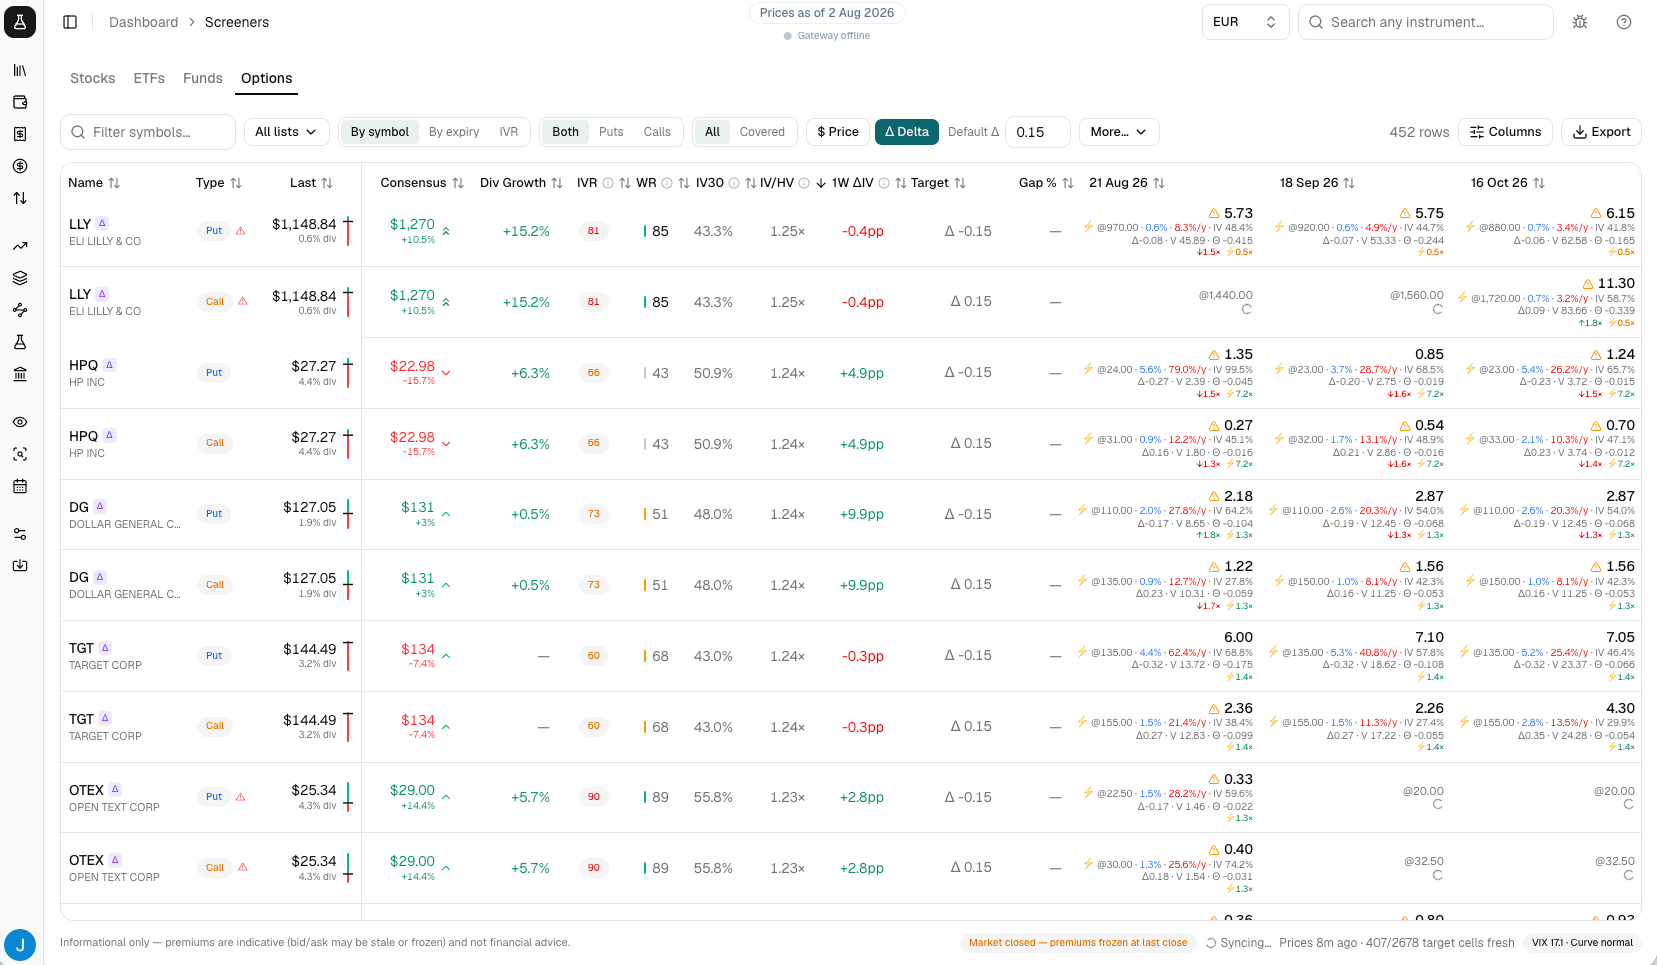
Wheel Rank scores every name from 0 to 100 on how reliably it can be wheeled — and unlike the proprietary scores elsewhere, you can read the formula and see each component.
- ✓Consistency of 52-week implied volatility rank, not a single snapshot
- ✓Put/call open-interest balance — is there a real market on both legs
- ✓Median premium quality at the 30-delta strike
- ✓Every component visible and the weighting published — no black box
Find the roll that's actually worth it
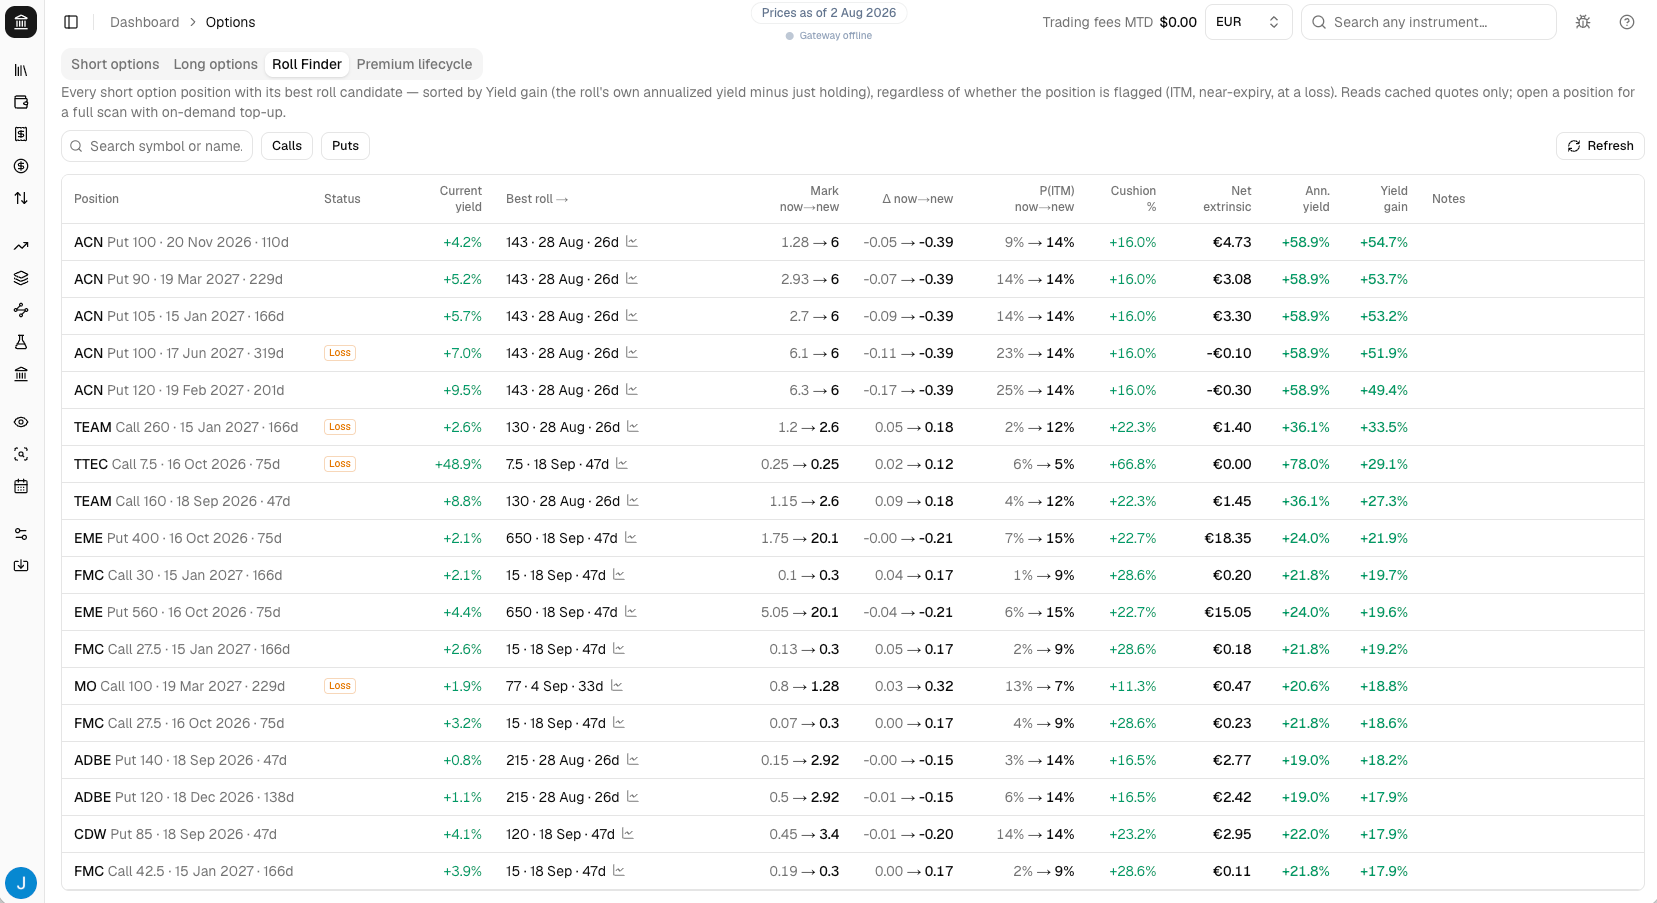
Not just which contracts pay — which ones pay more than the leg you already hold. And on the stock side, which of your holdings can carry a call without putting shares you want to keep at risk.
- ✓Rolls ranked by yield gain versus your existing position, not raw premium
- ✓Covered Call Finder: free lots, low-risk lots, and lots already committed
- ✓Mark-plausibility guards so a stale quote never fakes an opportunity
- ✓Scan on demand from the position drawer, or across the whole book
How you actually trade, measured honestly
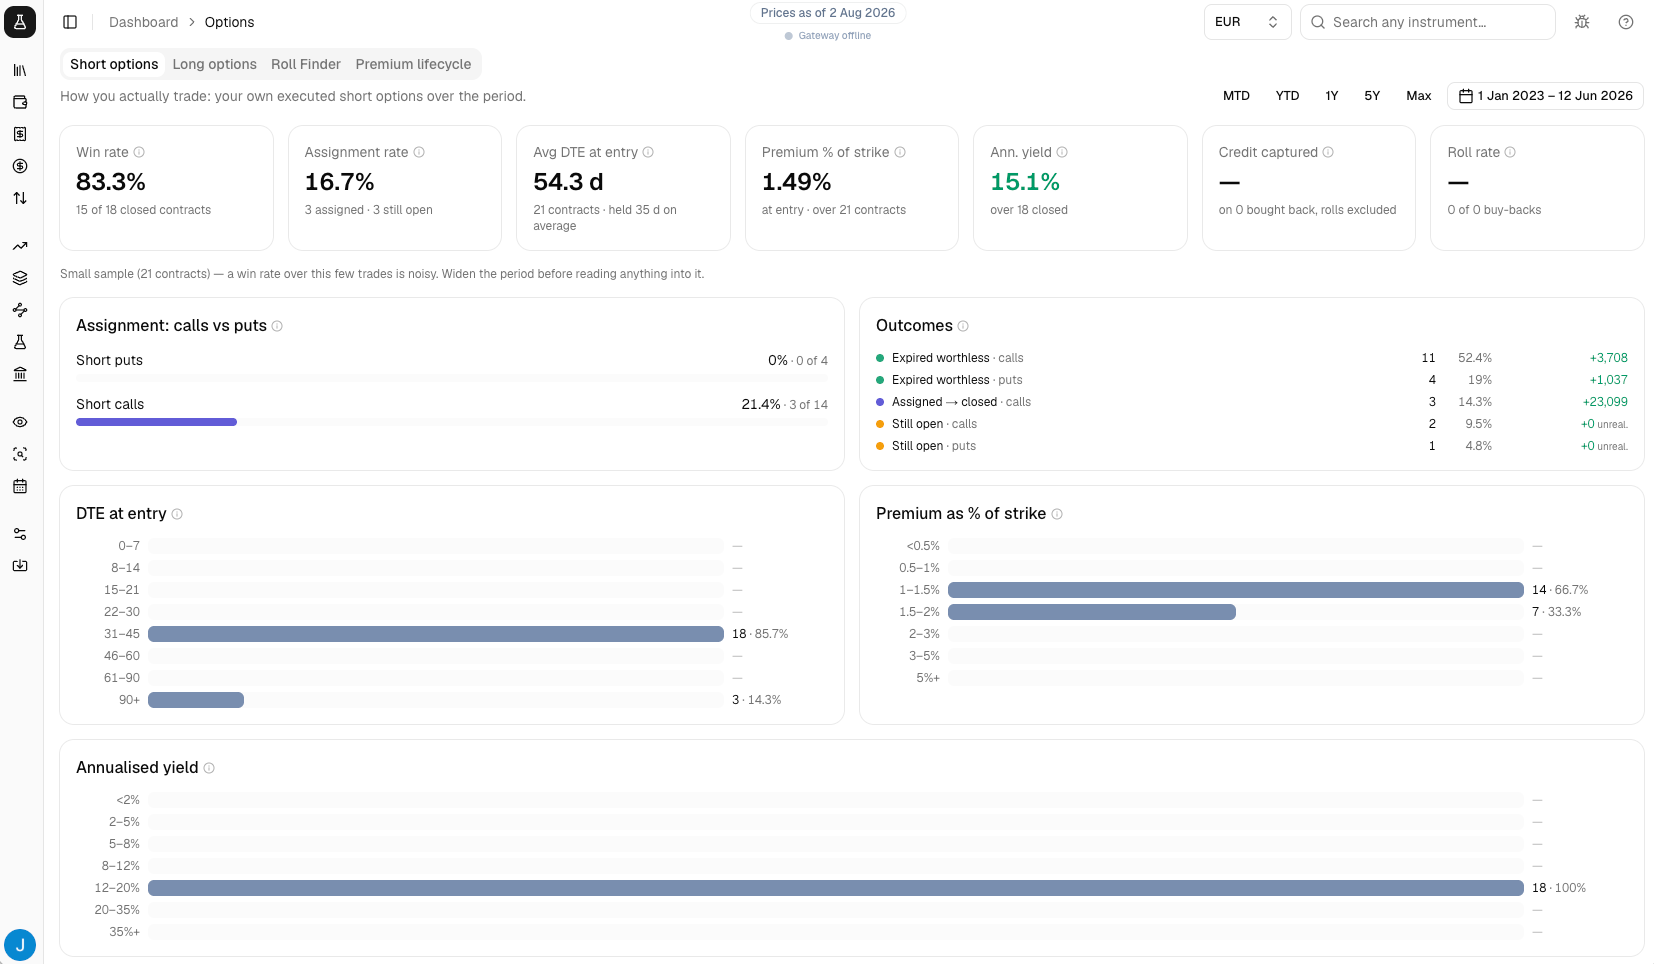
Win rate with assignments counted in the denominator where they belong. Days to expiry at entry. Credit actually captured. And delta at entry — reconstructed for historical trades rather than guessed.
- ✓Short and long scorecards, because an expired option is a win for one side and a total loss for the other
- ✓Assignment rate split between calls and puts
- ✓Roll campaigns tracked as one position across successive contracts
- ✓Delta at entry recovered by Black-Scholes inversion on historical contract prices
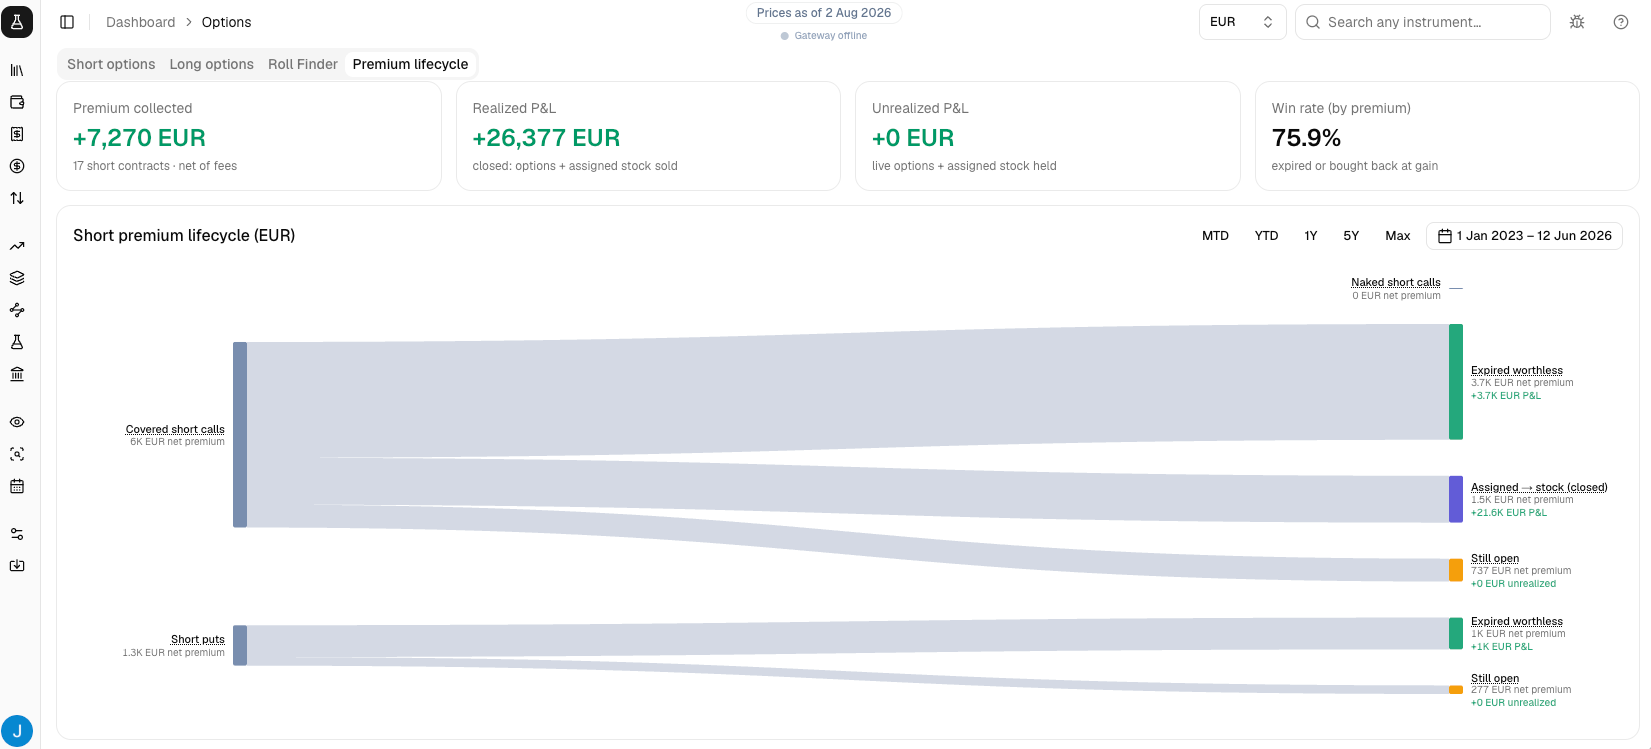
Where every premium you collected actually ended up
A credit received is not a profit — it is a position with an unresolved fate. This traces each one from the moment it was sold to how it finished: expired, bought back at a gain or a loss, assigned, or still open and at risk.
- ✓Premium routed by outcome — expired, closed for gain, closed for loss, assigned, still open
- ✓Split by book: covered calls, naked calls, cash-secured puts
- ✓Realized P&L kept separate from the unrealized latent on open legs
- ✓Any period, in your reference currency, drillable down to the contract
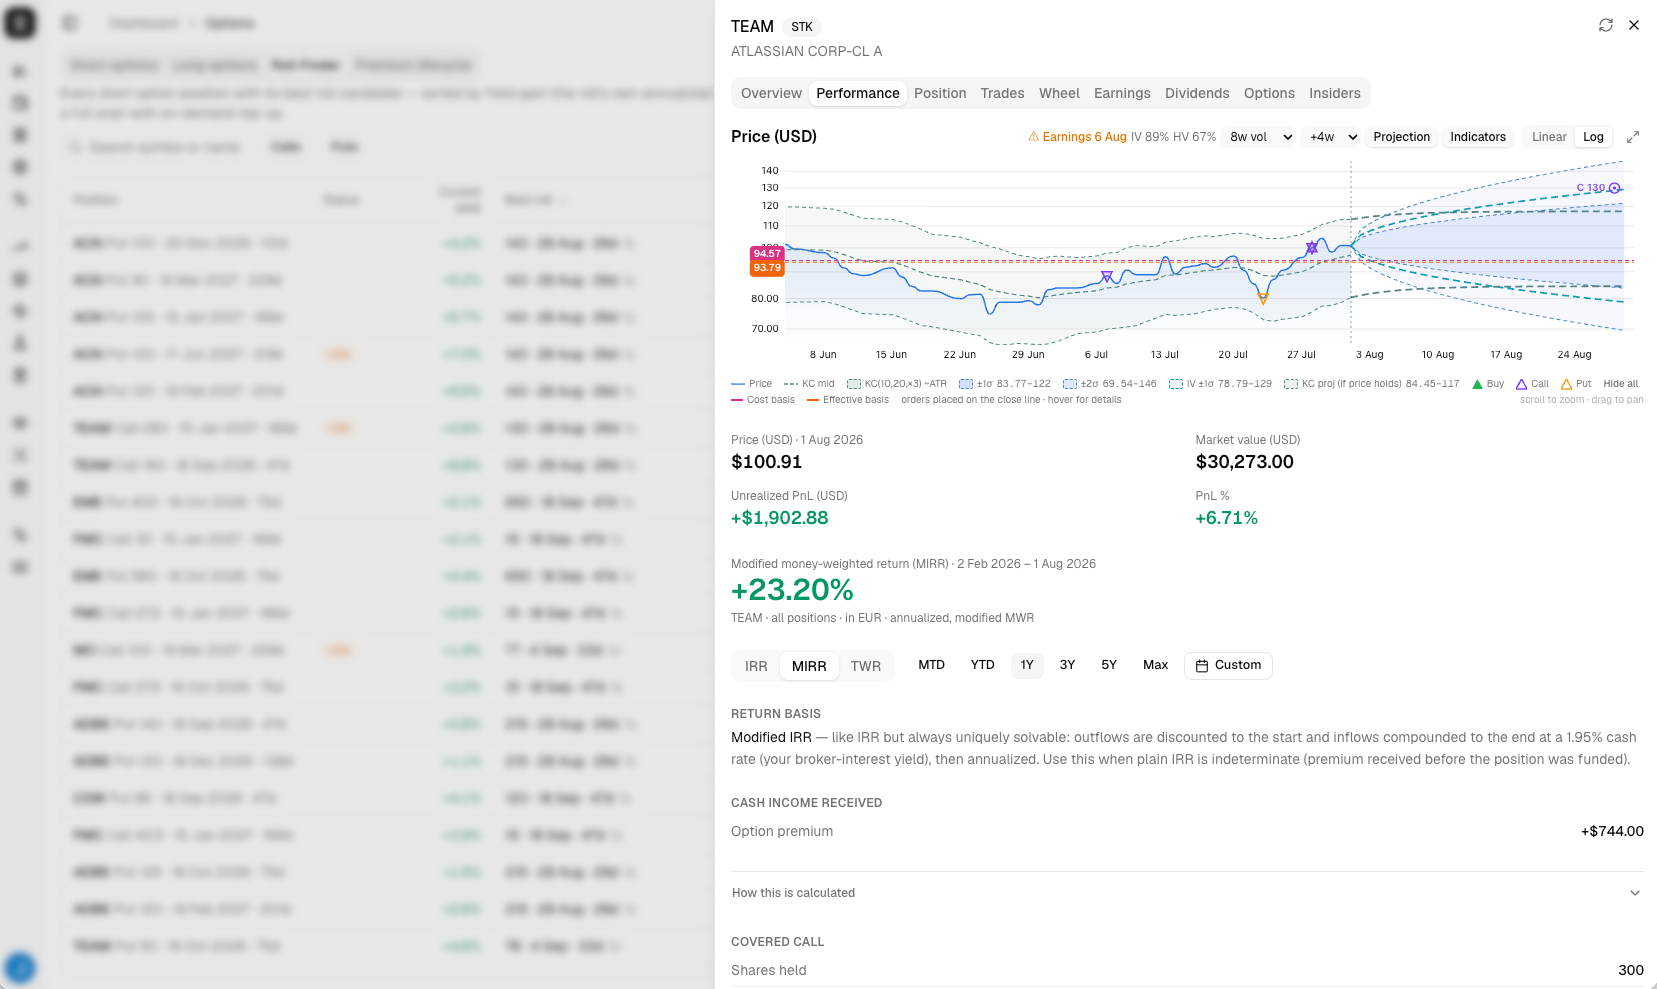
Assignment probability, not delta hand-waving
Delta is a convenient proxy and a wrong one — it overstates calls and understates puts. Cresori computes the real thing, and shows you the volatility cone your strike is sitting in.
- ✓Probability of finishing in the money via N(d2), plus probability of touch
- ✓±1σ and ±2σ realized-volatility cone, with an implied-vol envelope to compare
- ✓Covered call P&L answered three ways: option leg, adjusted basis, assigned gain
- ✓A guardrail that warns before you write a call below your own cost basis
And the rest of the income side
Cadence, signals and the denominators that decide whether a premium was worth collecting.
By week, month or year
Premium received bucketed on the cadence you actually think in, with weighted totals in your base currency.
Income, decomposed
How much of your return was option premium versus stock P&L, dividends, cash interest and fees.
IV rank & expected move
Ten years of implied-volatility history per ticker, plus the statistical and straddle-priced expected move.
CSP income signals
Skew, roll chain, IV and leverage badges, with earnings-before-expiry candidates filtered out.
Yield on your terms
Per-holding or per-contract denominators, roll pairing, and a toggle for netting worthless expiries.
How it compares
Options dashboards go deep and stop at your broker. Generic trackers cover everything and understand none of it.
| Cresori | Options dashboards* | Generic trackers | |
|---|---|---|---|
| Wheel reassembled as one economic cycle | |||
| Wheel quality score per ticker | |||
| Heat map priced on extrinsic value | |||
| Roll ranked by gain vs your held leg | |||
| Assignment probability via N(d2) | |||
| Return on deployed capital | |||
| Delta at entry on historical trades | |||
| Published, readable scoring formulas | |||
| Works with the broker gateway offline | |||
| Your data stays on your machine |
* Wheel- and theta-focused dashboards. Comparison is indicative and reflects our own testing; features vary by plan and change over time.
Every number is one you can check.
Scores here are not proprietary black boxes. The formulas are published, the inputs are visible, and where a figure could not be reconstructed honestly it is left blank rather than filled in with a plausible guess. You can export the underlying trade log as CSV and check any line yourself.
See everything else Cresori doesRun it on your own book.
Join the waitlist and put your own wheel through it when early access opens.